Showing posts with label january. Show all posts

Thursday, March 26, 2015

Large Luxury SUV Sales In Canada January 2015

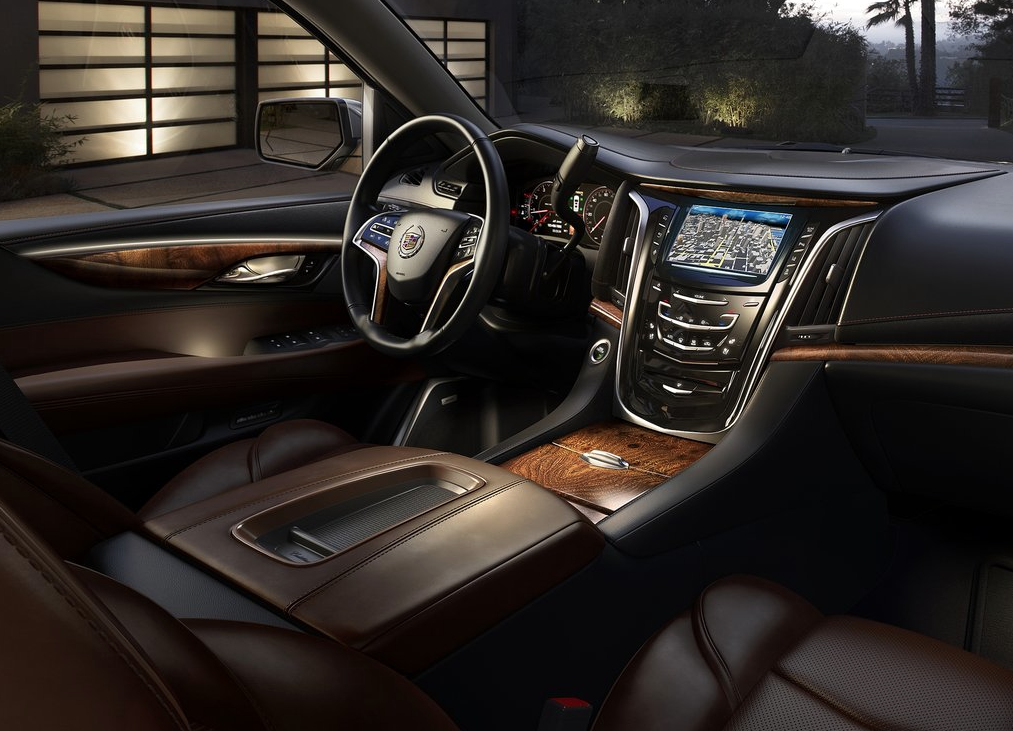
2015 Cadillac Escalade interior
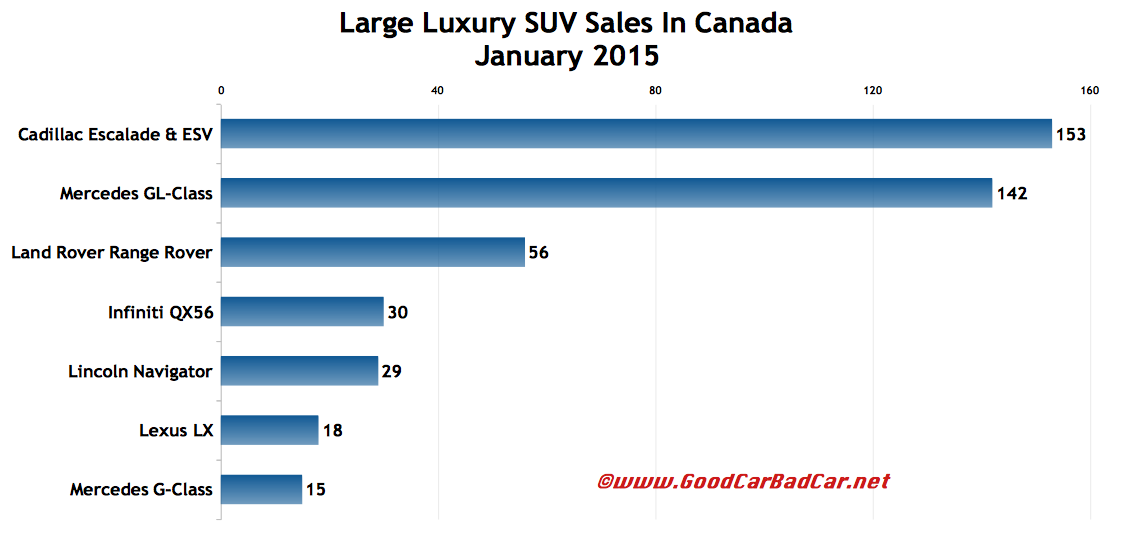
Canadian sales of the regular-wheelbase Cadillac Escalade jumped 459% to 123 units in January 2015. None of its four less-expensive platform-sharing partners generated that many sales in Canada last month. (GMC sold 116 Yukons.)


Canada Vehicle Sales Rankings By Make & Model - January 2015
• Canada SUV/Crossover Sales Rankings By Model - January 2015


Canada large luxury SUV sales chart January 2015
Click Chart To Expand
Added to that were 30 long-wheelbase Escalade ESV sales. In other words, the Escalade ESV outsold the whole Lincoln Navigator lineup, short and long-wheelbase models combined.

Mercedes-Benz Canada reported a 39% increase in sales of the GL-Class, a 40-unit improvement. Unlike the Escalade, QX80, Range Rover, LX570, and G-Class, the GL is available with a six-cylinder powerplant. It can also be purchased with a diesel engine.

You can click any model name in the tables below to find historical monthly and yearly Canadian auto sales data. You can also select a make and model at GCBCs Sales Stats page. This table is sortable, so you can rank large luxury SUVs any which way you like. Suggestions on how GCBC should break down segments can be passed on through the Contact page.

Click Column Headers To Sort • December 2014 • January 2014
Large Luxury SUV
January
2015
January 2014
%
Change
2015
YTD
2014
YTD
%
Change
Cadillac Escalade
& Escalade ESV/EXT
153
32378%153 32 378%
Infiniti QX80
30
46-34.8%30 46 -34.8%
Land Rover Range Rover
56
87-35.6%56 87 -35.6%
Lexus LX570
18
25-28.0%18 25 -28.0%
Lincoln Navigator
29
30-3.3%29 30 -3.3%
Mercedes-Benz G-Class
15
19-21.1%15 19 -21.1%
Mercedes-Benz GL-Class
142
10239.2%142 102 39.2%
---
---
--------- --- ---
Total
443
34129.9%443 341 29.9%
Source: Automakers & ANDC
GCBC isnt here to break down segments, an impossible task for any group, but to display sales data for the sake of comparison. The more ways sales data can be displayed, the better. You can always find the sales results for EVERY vehicle and form your own competitive sets by using the All Vehicle Rankings posts.

RECOMMENDED READING
Large Luxury SUV Sales In Canada - December & 2014 Year End
Large Luxury SUV Sales In Canada - January 2014
Top 20 Best-Selling SUVs In Canada - January 2015
Canada Auto Sales Brand Rankings - January 2015
Small & Midsize Luxury SUV Sales In Canada - January 2015

Small Car Sales In America January 2015

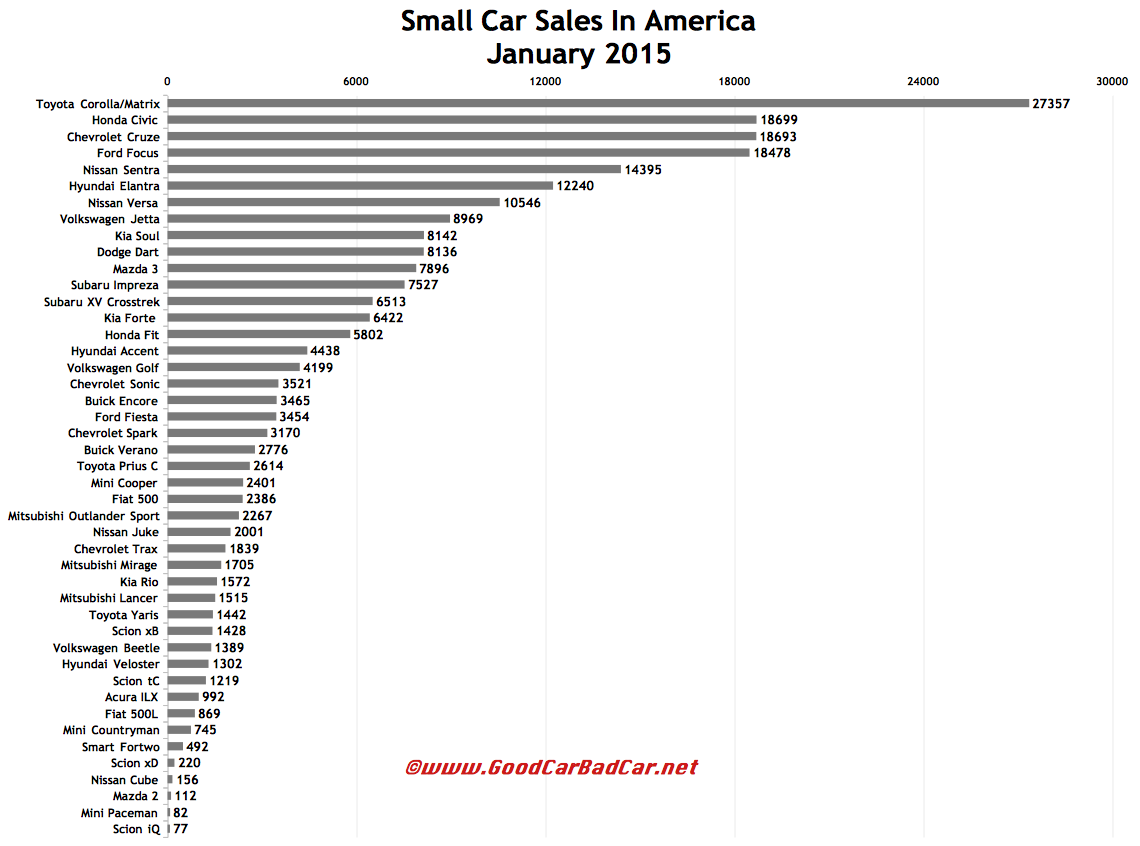
In what was a best-ever January for the Toyota Corolla, first month U.S. sales of compact cars jumped 16% compared with January 2014. 


• U.S. Vehicle Sales Rankings By Model - January 2015
• U.S. Car Sales Rankings By Model - January 2015


USA small car sales chart January 2015
Click Chart To Expand
Huge increases from the Dodge Dart, Ford Focus, Nissan Sentra, and Volkswagen Golf – together with otherwise quite meaningful jumps from the Chevrolet Cruze, Kia Forte, Mazda 3, Mitsubishi Lancer, Subaru Impreza, and the Corolla itself - translated to nearly 22,000 extra sales for our strictly defined compact category.

Subcompact cars, meanwhile, despite disastrous results from the Chevrolet Sonic (worst month since its first full month on sale, September 2011), Ford Fiesta (fourth consecutive month below 4K), Kia Rio (worst month for the current-gen model), and Mazda 2 (replace me now!) were nearly cancelled out by Fit, Accent, Versa, and Toyota gains. 

Elsewhere in the small car world, Minis selling a fair number of new Coopers, the Hardtop models, not the dying Clubmans and Roadsters and Coupes. Buick and Chevrolet combined to sell more than 5000 copies of their small urban crossover twins, the Encore and Trax. And in addition to the 7527 Imprezas, WRXs, and STis sold in January, Subaru also sold 6513 XV Crosstreks.

You can click any model name in the tables below to find historical monthly and yearly U.S. auto sales data. You can also select a make and model at GCBCs Sales Stats page. These tables are now sortable, so you can rank small cars of all kinds any which way you like. Suggestions on how GCBC should break down segments can be passed on through the Contact page.

Click Column Headers To Sort • February 2015 • December 2014 • January 2014
Compact
January
2015
January
2014
%
Change
2015
YTD
2014
YTD

Change
Acura ILX *
992
1157-14.3%9921157-14.3%
Buick Verano
2776
3120-11.0%27763120-11.0%
Chevrolet Cruze
18,693
16,82811.1%18,69316,82811.1%
Dodge Dart
8136
505161.1%8136505161.1%
Ford Focus
18,478
12,00353.9%18,47812,00353.9%
Honda Civic
18,699
21,824-14.3%18,699 21,824-14.3%
Hyundai Elantra
12,240
15,326-20.1%12,24015,326-20.1%
Kia Forte
6422
472435.9%6422472435.9%
Mazda 3
7896
623426.7%7896 623426.7%
Mitsubishi Lancer
1515
90068.3%1515 90068.3%
Nissan Sentra
14,395
912757.7%14,395 912757.7%
Subaru Impreza
7527
578530.1%7527578530.1%
Toyota Corolla/Matrix
27,357
22,75320.2%27,35722,75320.2%
Volkswagen Golf
4199
1712145%41991712145%
Volkswagen Jetta
8969
9768-8.2%89699768-8.2%
---
---
--------- --- ---
Total
158,294
136,31216.1%158,294 136,312 16.1%

Subcompact
January
2015
January
2014
%
Change
2015
YTD
2014
YTD
%
Change
Chevrolet Sonic
3521
6587-46.5%35216587-46.5%
Ford Fiesta
3454
4162-17.0%34544162-17.0%
Honda Fit
5802
312285.8%5802312285.8%
Hyundai Accent
4438
42404.7%443842404.7%
Kia Rio
1572
3162-50.3%15723162-50.3%
Mazda 2
112
907-87.7%112 907-87.7%
Nissan Versa
10,546
852423.7%10,546852423.7%
Toyota Prius C
2614
24676.0%261424676.0%
Toyota Yaris
1442
100543.5%1442100543.5%
---
---
--------- --- ---
Total
33,501
34,176-2.0%33,501 34,176 -2.0%

City Car
January
2015
January
2014
%
Change
2015
YTD
2014
YTD
%
Change
Chevrolet Spark
3170
184871.5%3170184871.5%
Mitsubishi Mirage
1705
117045.7%1705117045.7%
Scion iQ
77
166-53.6%77166-53.6%
Smart Fortwo
492
521-5.6%492521-5.6%
---
---
--------- --- ---
Total
5444
370546.9%5444 3705 46.9%

Warm Hatches
January
2015
January
2014
%
Change
2015
YTD
2014
YTD
%
Change
Fiat 500 *
2386
2493-4.3%23862493 -4.3%
Hyundai Veloster *
1302
1821-28.5%13021821 -28.5%
Mini Cooper *
2401
135876.8%24011358 76.8%
Scion tC *
1219
110710.1%1219 1107 10.1%
Volkswagen Beetle *
1389
2034-31.7%13892034 -31.7%
---
---
--------- --- ---
Total
8697
8813-1.3%8697 8813 -1.3%

Tall Hatchbacks & Crossovers
January
2015
January
2014
%
Change
2015
YTD
2014
YTD
%
Change
Buick Encore *
3465
236646.5%3465236646.5%
Chevrolet Trax *
1839
------1839------
Fiat 500L
869
72919.2%869 72919.2%
Kia Soul
8142
80920.6%8142 80920.6%
Mini Countryman *
745
1074-30.6%745 1074-30.6%
Mini Paceman *
82
111-26.1%82111-26.1%
Mitsubishi
Outlander Sport *
2267
183823.3%2267183823.3%
Nissan Cube
156
402-61.2%156402-61.2%
Nissan Juke *
2001
3442-41.9%20013442-41.9%
Scion xB
1428
122516.6%1428122516.6%
Scion xD
220
592-62.8%220592-62.8%
Subaru XV Crosstrek *
6513
480135.7%6513480135.7%
---
---
--------- --- ---
Total
27,727
24,67212.4%27,727 24,672 12.4%
Source: Automakers & ANDC
* vehicle also displayed in another GCBC segment breakdown
GCBC isnt here to break down segments, an impossible task for any group, but to display sales data for the sake of comparison. The more ways sales data can be displayed, the better. This explains why youll see the Encore and XV Crosstrek are listed with small SUVs, too, and the Acura ILX shown with mainstream cars is also displayed with luxury cars... because readers have wanted it both ways. You can always find the sales results for EVERY vehicle and form your own competitive sets by using the All Vehicle Rankings posts.

RECOMMENDED READING
Small Car Sales In America - February 2015 YTD
Small Car Sales In America - December & 2014 Year End
Small Car Sales In America - January 2014
Top 20 Best-Selling Cars In America - January 2015
U.S. Auto Sales Brand Rankings - January 2015
Midsize Car Sales In America - January 2015

Monday, March 23, 2015

January 2015 U S SUV And Crossover Sales Rankings Top 89 Best Selling SUVs In America Every SUV Ranked

2015 Lincoln MKC
Americas SUV/crossover market grew 19% in January 2015, a 63,000-unit improvement compared with January 2014.

For the fifth consecutive month, the Honda CR-V was Americas top-selling utility vehicle. The CR-V outsold the second-ranked Ford Escape by 3157 units. The third-ranked Toyota RAV4, the last utility vehicle to outsell the CR-V on a monthly basis, was just 230 sales back of the Escape.


• U.S. SUV/Crossover Sales Rankings By Model - February 2015 YTD
• U.S. SUV/Crossover Sales Rankings By Model - 2014 Year End
• U.S. SUV/Crossover Sales Rankings By Model - January 2014


U.S. sales of SUVs and crossovers expanded more rapidly than the overall market (+14%) in January but not quite as fast as the growth experienced in the pickup truck sector (+22%). 


Only a handful of moderately high-volume SUVs and crossovers posted year-over-year decreases: the Ford Edge, Dodge Durango, Buick Enclave, Cadillac SRX, and Hyundai Tucson, none of which sold half as often as the top-selling CR-V.


• Top 13 Best-Selling Pickup Trucks In America - January 2015
• Commercial Van Sales In America - January 2015
• Minivan Sales In America - January 2015


There were no new entrants in the utility vehicle arena in January, although the Volvo V60 Cross Country (which we label as a car) attracted its first 28 buyers. The Chevrolet Trax was in its second month on the U.S. market. It ranked 50th overall with 1839 sales, just behind the Mercedes-Benz GLA; just ahead of the Lexus GX460. 
The Trax, together with a number of premium brand utility vehicles which werent on sale at this time a year ago, accounted for 2.6% of all SUV and crossover sales in America in January.


• U.S. Auto Sales Brand Rankings - January 2015
• U.S. Vehicle Sales Rankings By Model - January 2015
• U.S. Car Sales Rankings By Model - January 2015


Reminder: these are January 2015 rankings, but you can sort SUVs/crossovers by January 2014 volume by clicking the January 2014 column header, or you can rank SUVs/crossovers by improvements or declines using the % columns. Or, most importantly, you can list automakers together by selecting the SUV/Crossover column header.

As always, you can find historical monthly and yearly sales figures for any of these vehicles by selecting a make and model at GCBCs Sales Stats page.

Click Column Headers To Sort • February 2015 • December 2014 • January 2014
Rank
SUV/Crossover
January 2015
January 2014
%
Change
#1Honda CR-V23,211 18,232 27.3%
#2Ford Escape20,054 19,459 3.1%
#3Toyota RAV419,824 16,880 17.4%
#4Chevrolet Equinox19,555 14,547 34.4%
#5Ford Explorer17,036 12,810 33.0%
#5.1Ford Explorer *14,99511,69628.2%
#5.2Ford Explorer Police Interceptor *2,0411,11483.2%
#6Nissan Rogue15,649 13,831 13.1%
#7Jeep Cherokee15,154 10,505 44.3%
#8Jeep Grand Cherokee12,806 12,207 4.9%
#9Honda Pilot12,315 6,224 97.9%
#10Jeep Wrangler11,683 9,553 22.3%
#11Subaru Forester11,210 10,771 4.1%
#12Toyota Highlander11,060 10,676 3.6%
#13Chevrolet Traverse10,151 5,368 89.1%
#14GMC Terrain8,844 7,063 25.2%
#15Hyundai Santa Fe7,749 6,721 15.3%
#16Ford Edge7,581 9,411 -19.4%
#17Jeep Patriot7,563 5,577 35.6%
#18Kia Sorento7,543 7,098 6.3%
#19Dodge Journey7,041 5,936 18.6%
#20Toyota 4Runner6,945 3,958 75.5%
#21Chevrolet Tahoe6,607 3,514 88.0%
#22Lexus RX6,569 5,607 17.2%
#23Nissan Pathfinder6,138 5,308 15.6%
#24Mazda CX-55,949 4,998 19.0%
#25GMC Acadia5,898 5,463 8.0%
#26Acura MDX4,381 4,241 3.3%
#27Jeep Compass4,317 4,068 6.1%
#28Chevrolet Suburban4,130 1,705 142%
#29Nissan Murano3,773 2,188 72.4%
#30Dodge Durango3,585 4,128 -13.2%
#31Acura RDX3,517 2,730 28.8%
#32Buick Enclave3,497 3,509 -0.3%
#33Cadillac SRX3,485 4,446 -21.6%
#34Buick Encore3,465 2,366 46.5%
#35BMW X53,214 2,754 16.7%
#36Mercedes-Benz M-Class3,144 2,824 11.3%
#37Kia Sportage3,054 2,587 18.1%
#38Hyundai Tucson3,036 3,533 -14.1%
#39Audi Q52,927 2,774 5.5%
#40Lexus NX2,812 --- ---
#41Cadillac Escalade ^2,7641,085155%
#41.1Cadillac Escalade *1,664704136%
#41.2Cadillac Escalade ESV *1,100381189%
#42GMC Yukon2,649 1,287 106%
#43Infiniti QX602,577 2,380 8.3%
#44Ford Expedition2,460 2,139 15.0%
#45Mitsubishi Outlander Sport2,267 1,838 23.3%
#46Mercedes-Benz GL-Class2,121 1,541 37.6%
#47Nissan Juke2,001 3,442 -41.9%
#48GMC Yukon XL1,965 865 127%
#49Mercedes-Benz GLA-Class1,878 --- ---
#50Chevrolet Trax1,839 --- ---
#51Lexus GX4601,803 1,443 24.9%
#52Land Rover Range Rover Sport1,752 1,612 8.7%
#53Lincoln MKC1,602 ------
#54Volvo XC601,517 942 61.0%
#55Land Rover Range Rover1,481 1,221 21.3%
#56Volkswagen Tiguan1,473 1,777 -17.1%
#57Ford Flex1,458 1,650 -11.6%
#58Land Rover Range Rover Evoque1,403 879 59.6%
#59Mercedes-Benz GLK-Class1,398 2,302 -39.3%
#60Lincoln MKX1,358 2,479 -45.2%
#61BMW X31,341 2,699 -50.3%
#62Mazda CX-91,269 1,490 -14.8%
#63Infiniti QX801,248 1,023 22.0%
#64Porsche Cayenne1,116 1,158 -3.6%
#65Nissan Armada1,029 1,029 0.0%
#66Mitsubishi Outlander1,003 941 6.6%
#67Nissan Xterra998 1,518 -34.3%
#68Lincoln Navigator916 375 144%
#69Toyota Sequoia904 787 14.9%
#70Audi Q7880 1,268 -30.6%
#71Audi Q3873 ------
#72Porsche Macan796 ------
#73Mini Countryman745 1,074 -30.6%
#74Land Rover LR4609 599 1.7%
#75Infiniti QX70557 645 -13.6%
#76BMW X1518 1,332 -61.1%
#77Volkswagen Touareg482 544 -11.4%
#78BMW X6433 382 13.4%
#79BMW X4396 ------
#80Lexus LX570293 356 -17.7%
#81Lincoln MKT268 362 -26.0%
#82Toyota Land Cruiser251 257 -2.3%
#83Mercedes-Benz G-Class231 122 89.3%
#84Infiniti QX50188 197 -4.6%
#85Toyota FJ Cruiser158 1,162 -86.4%
#86Mini Paceman82111-26.1%
#87Volvo XC9038 459 -91.7%
#88Land Rover LR236 363 -90.1%
#89Chevrolet Captiva Sport10 3,765 -99.7%
#90Subaru Tribeca---86 -100%
#91Acura ZDX---14 -100%
#92Hyundai Veracruz---1 -100%
---
Total
391,906328,57119.3%
---
---
------ ---
Source: Automakers & ANDC

* Italicized, asterisked, unranked lines are nothing more than available breakdowns, already included in the models total, not in addition to the models total.
^ Escalade here does not include sales of the EXT, which is shown with pickup trucks.
Rather than listing the 500L with the Mini Paceman and Countryman in these SUV/crossover rankings, its with cars in large part because it is not available with all-wheel-drive. The placement of numerous crossovers often prompts disagreement, but consider the vehicle types name: crossover. By its very definition, it crosses over from one category into another. The very act of calling, for example, the Toyota Venza a car or a utility vehicle requires ignorance of the fact that the Venza (or Outback, Crosstour, Encore, Countryman, 500L) is a square peg that cant be squeezed through a round hole.
Sunday, March 22, 2015

Large Luxury Car Sales In America January 2015

2015 Jaguar XJR interior
U.S. sales of the Mercedes-Benz S-Class have now topped the 1K barrier in 16 consecutive months.


• U.S. Vehicle Sales Rankings By Model - January 2015
• U.S. Car Sales Rankings By Model - January 2015


USA large luxury car sales chart January 2015
Click Chart To Expand
During that period, stretching back to October 2013, Audis A8, Jaguar XJ, and Porsche Panamera havent done so once, while the BMW 7-Series and Lexus LS only did it four times each. 

S-Class volume was up 22% from 1281 units in January 2014 - the lowest-volume month in that 16-month span - to 1566 units.

Thats more than double the number of U.S. sales achieved by any of the S-Classs rivals in January 2015.

You can click any model name in the tables below to find historical monthly and yearly U.S. auto sales data. You can also select a make and model at GCBCs Sales Stats page. These tables are now sortable, so you can rank large luxury cars any which way you like. Suggestions on how GCBC should break down segments can be passed on through the Contact page.

Click Column Headers To Sort • February 2015 • December 2014 • January 2014
Large Luxury Car
January
2015
January
2014
%
Change
2015
YTD
2014
YTD

Change
Audi A7 *
285
624-54.3%285 624 -54.3%
Audi A8
306
337-9.2%306 337 -9.2%
BMW 6-Series *
511
5070.8%511 507 0.8%
BMW 7-Series
637
57510.8%637 575 10.8%
Jaguar XJ
275
394-30.2%275 394 -30.2%
Lexus LS
666
6345.0%666 634 5.0%
Mercedes-Benz CLS-Class *
406
420-3.3%406 420 -3.3%
Mercedes-Benz S-Class
1566
128122.2%1566 1281 22.2%
Porsche Panamera
437
546-20.0%437 546 -20.0%
---
---
------------ ---
Total
5089
5316-4.3%5089 5316 -4.3%
Source: Automakers & ANDC
GCBC isnt here to break down segments, an impossible task for any group, but to display sales data for the sake of comparison. The more ways sales data can be displayed, the better. This explains why youll see the the A7 and CLS here but also with midsize luxury cars... because readers have wanted it both ways. You can always find the sales results for EVERY vehicle and form your own competitive sets by using the All Vehicle Rankings posts. Sales data for brands such as Aston Martin, Ferrari, Lamborghini, Lotus, Rolls-Royce etc. are unfortunately not broken down by model. ANDC estimates say sales for those brands in January were 103, 177, 63, 15, and 77, respectively. Tesla, unfortunately, doesnt release model-specific monthly U.S. sales data, but HybridCars.com estimates 1300 January Tesla sales.

RECOMMENDED READING
Large Luxury Car Sales In America - February 2015 YTD
Large Luxury Car Sales In America - December & 2014 Year End
Large Luxury Car Sales In America - January 2014
Top 20 Best-Selling Cars In America - January 2015
U.S. Auto Sales Brand Rankings - January 2015
Small & Midsize Luxury Car Sales In America - January 2015