Showing posts with label canada. Show all posts

Saturday, March 28, 2015

Small Car Sales In Canada October 2014 YTD

2014 Dodge Dart grey
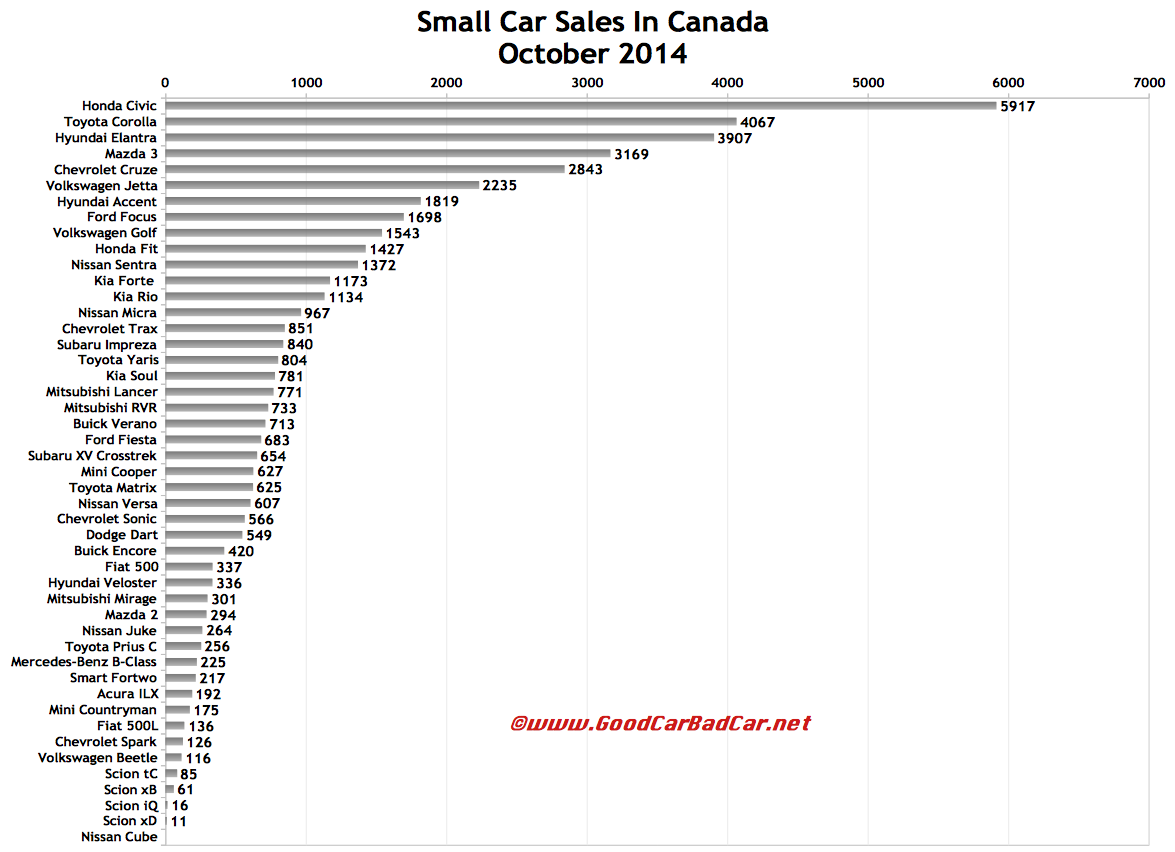
During a month in which the Chrysler 200 led all midsize cars in terms of Canadian sales volume, Dodge Dart sales slid 14% to just 549 units. 


• Canada Vehicle Sales Rankings By Model - October 2014 YTD
• Canada Car Sales Rankings By Model - October 2014 YTD

Canada small car sales chart October 2014
The core compact sector accounted for 48% of Canadian new car sales in October 2014. Midsize cars attracted just 15% of car buyers. Yet in Chrysler Canadas stores, midsize cars generated 53% of car sales in October, while the Dart produced just 16% of the automakers October car volume.

This tells two stories. The first? Chrysler 200 sales are strong because its a nice new car, but also because its priced ridiculously low. Really, truly, very low. Second? The 200 clearly eats into the Darts territory, not that the Dart has ever been capable of broadly expanding its borders. 

In a category where the class-leading Honda Civic averages more than 5700 monthly sales in Canada, Dodge has only sold more than 1000 Darts on six occasions in the 29 months in which its been on the market, and only once this year. 

Yet the Chrysler Group was Canadas largest seller of automobiles in October 2014, ahead of the Ford Motor Company, General Motors, Toyota, and Hyundai-Kia. Pickup trucks, SUVs, crossovers, and minivans accounted for 84% of the companys sales last month. Cars, including the Civic and surging Fit - Canadas second-best-selling subcompact in October - bring in two-thirds of the Honda brands volume.

You can click any model name in the tables below to find historical monthly and yearly Canadian auto sales data. You can also select a make and model at GCBCs Sales Stats page. These tables are now sortable, so you can rank small cars of all kinds any which way you like. Suggestions on how GCBC should break down segments can be passed on through the Contact page.

Click Column Headers To Sort • November 2014 • September 2014 • October 2013
Compact
October
2014
October
2013
%
Change
2014
YTD
2013
YTD

Change
Acura ILX *
192
15623.1%24122834-14.9%
Buick Verano *
713
52236.6%6347502026.4%
Chevrolet Cruze
2843
3127-9.1%29,02128,4901.9%
Dodge Dart
549
641-14.4%70678150-13.3%
Ford Focus
1698
1872-9.3%19,58022,776-14.0%
Honda Civic
5917
6852-13.6%57,853 54,9505.3%
Hyundai Elantra
3907
4021-2.8%43,96748,366-9.1%
Kia Forte
1173
81444.1%10,39999754.3%
Mazda 3
3169
3821-17.1%36,185 34,0246.4%
Mitsubishi Lancer
771
57733.6%5816 6626-12.2%
Nissan Sentra
1372
117816.5%12,968 12,6732.3%
Subaru Impreza
840
899-6.6%875885342.6%
Suzuki SX4
---
40-100%---1431-100%
Toyota Corolla
4067
4312-5.7%43,10238,43012.2%
Toyota Matrix
625
668-6.4%65649790-33.0%
Volkswagen Golf
1543
85879.8%960410,365-7.3%
Volkswagen Jetta
2235
3267-31.6%27,45126,5653.3%
---
---
--------- --- ---
Total
31,614
33,625-6.0%327,094 328,999 -0.6%

Subcompact
October
2014
October
2013
%
Change
2014
YTD
2013
YTD
%
Change
Chevrolet Sonic
566
729-22.4%69118302-16.8%
Ford Fiesta
683
794-14.0%80548792-8.4%
Honda Fit
1427
89160.2%9079686632.2%
Hyundai Accent
1819
139330.6%20,56017,18619.6%
Kia Rio
1134
1174-3.4%13,22614,180-6.7%
Mazda 2
294
26610.5%2130 3523-39.5%
Nissan Versa
607
1424-57.4%11,90110,18416.9%
Toyota Prius C
256
2358.9%23572582-8.7%
Toyota Yaris
804
69915.0%7605674112.8%
---
---
--------- --- ---
Total
7590
7605-0.2%81,823 78,356 4.4%

City Car
October
2014
October
2013
%
Change
2014
YTD
2013
YTD
%
Change
Chevrolet Spark
126
217-41.9%14672235-34.4%
Mitsubishi Mirage
301
20944.0%35612901128%
Nissan Micra
967
------6063------
Scion iQ
16
48-66.7%296435-32.0%
Smart Fortwo
217
232-6.5%194219081.8%
---
---
--------- --- ---
Total
1627
706130%13,329 4868 174%

Warm Hatches
October
2014
October
2013
%
Change
2014
YTD
2013
YTD
%
Change
Fiat 500 *
337
381-11.5%51166184 -17.3%
Hyundai Veloster *
336
3253.4%31394219 -25.6%
Mini Cooper *
627
286119%25383298 -23.0%
Scion tC *
85
122-30.3%1057 1298 -18.6%
Volkswagen Beetle *
116
130-10.8%17322083 -16.9%
---
---
--------- --- ---
Total
1501
124420.7%13,582 17,082 -20.5%

Tall Hatchbacks & Crossovers
October
2014
October
2013
%
Change
2014
YTD
2013
YTD
%
Change
Buick Encore *
420
445-5.6%4765294861.6%
Chevrolet HHR
---
---------6-100%
Chevrolet Trax *
851
62735.7%7452613421.5%
Dodge Caliber
---
--------- 7-100%
Fiat 500L
136
1341.5%2189 714207%
Kia Soul
781
64820.5%8708 670130.0%
Mercedes-Benz B-Class *
225
291-22.7%2346 2717-13.7%
Mini Countryman *
175
231-24.2%1782 16229.9%
Mitsubishi RVR *
733
58525.3%56936419-11.3%
Nissan Cube
---
15-100%15171-91.2%
Nissan Juke *
264
382-30.9%32323507-7.8%
Scion xB
61
67-9.0%581723-19.6%
Scion xD
11
25-56.0%241326-26.1%
Subaru XV Crosstrek *
654
662-1.2%60205067-18.8%
---
---
--------- --- ---
Total
4311
41124.8%43,024 37,062 16.1%
Source: Automakers & ANDC
* indicates a vehicle which is also shown in another GCBC segment breakdown.
GCBC isnt here to break down segments, an impossible task for any group, but to display sales data for the sake of comparison. The more ways sales data can be displayed, the better. This explains why youll see the Encore and XV Crosstrek are listed with small SUVs, too, and the Acura ILX shown with mainstream cars is also displayed with luxury cars... because readers have wanted it both ways. You can always find the sales results for EVERY vehicle and form your own competitive sets by using the All Vehicle Rankings posts.

RECOMMENDED READING
Small Car Sales In Canada - November 2014 YTD
Small Car Sales In Canada - September 2014 YTD
Small Car Sales In Canada - October 2013 YTD
Top 20 Best-Selling Cars In Canada - October 2014
Canada Auto Sales Brand Rankings - October 2014 YTD
Midsize Car Sales In Canada - October 2014 YTD
Friday, March 27, 2015

Commercial Van Sales In Canada November 2014 YTD

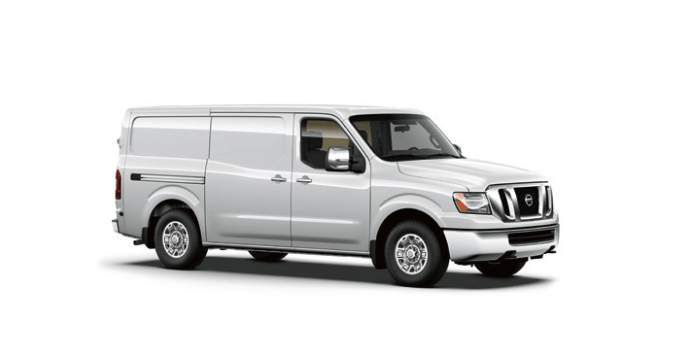
2014 Nissan NV white
Canadas commercial van market has persevered through a time of great upheaval to report vastly improved sales through the first eleven months of 2014. 


• Canada Vehicle Sales Rankings By Model - November 2014 YTD


Canada commercial van sales chart November 2014
Click Chart To Expand
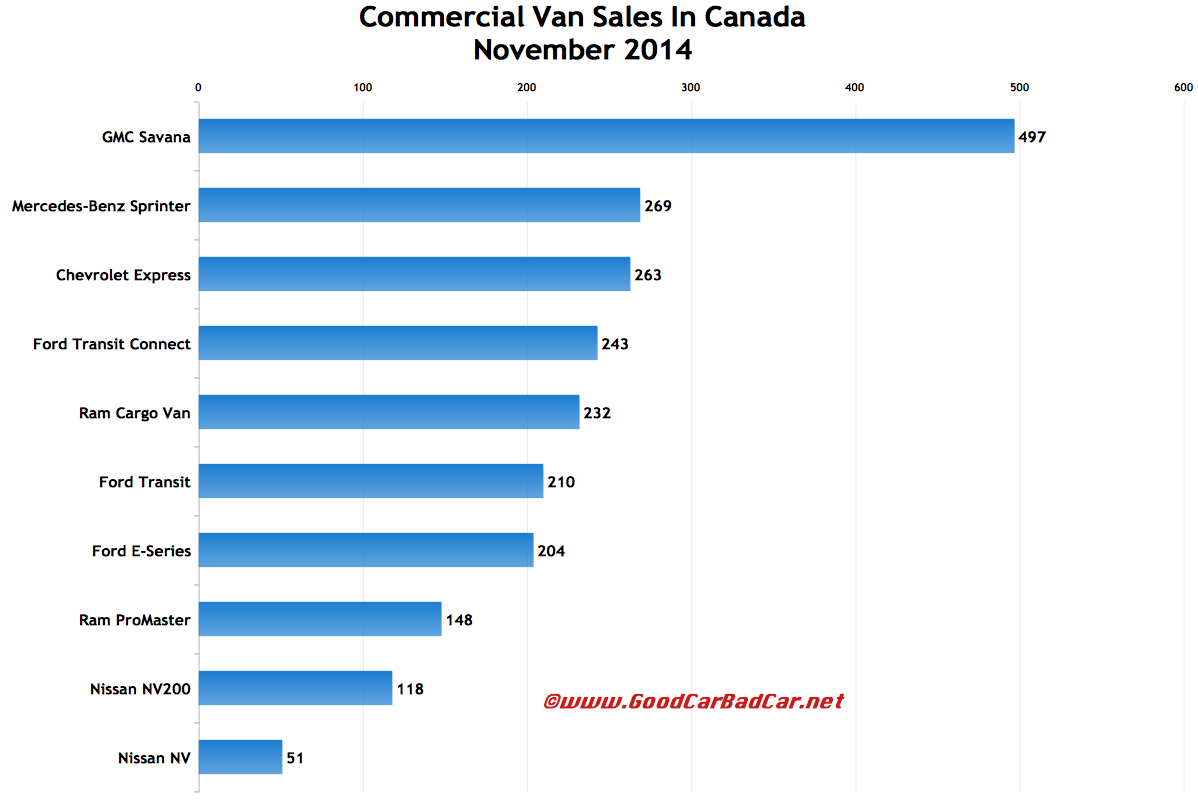
With the traditional best seller, Fords E-Series, being extinguished in favour of the Ford Transit, Fords market share in the full-size category fell from 35.7% in the first eleven months of 2013 to 25.7% in the same period one year later. 

November was the first month in which the new Transit recorded a meaningful level of sales.

But with renewed strength from the GMC Savana, a continued surge from the Mercedes-Benz Sprinter, and new product in the form of the Ram ProMaster, full-size commercial van sales in Canada are up 14% this year. They account for 80% of the vans sold so far this year; 73% in November. 

The smaller trio of vans – soon to be joined by the Chevrolet City Express and Ram ProMaster City – are up just 7% year-to-date thanks to a slow start for the new Ford Transit Connect. But sales of the Ford, Nissan NV200, and Ram Cargo Van were up 56% in November.

You can click any model name in the tables below to find historical monthly and yearly Canadian auto sales data. You can also select a make and model at GCBCs Sales Stats page. These tables are now sortable, so you can rank commercial vans any which way you like. Suggestions on how GCBC should break down segments can be passed on through the Contact page.

Click Column Headers To Sort • December 2014 • October 2014 • November 2013
Van
November
2014
November
2013
%
Change
2014
YTD
2013
YTD
%
Change
Chevrolet Express ³
263
376 -30.1% 4344 4359 -0.3%
Ford E-Series ³
204
209 -2.4% 7362 7554 -2.5%
Ford Transit ³
210
--- --- 409 --- ---
Ford Transit Connect ²
243
166 46.4% 2655 3737 -29.0%
GMC Savana ³
497
388 28.1% 5541 4967 11.6%
Mercedes-Benz Sprinter ³
269
237 13.5% 3780 3130 20.8%
Nissan NV ³
51
69 -26.1% 637 965 -34.0%
Nissan NV200 ²
118
112 5.4% 1209 626 93.1%
Ram Cargo Van ²
232
103 125% 2244 1332 68.5%
Ram ProMaster ³
148
10245.1%2040 167 1122%
---
---
--------- --- ---
Full-Size Commercial Vans ³
1642
138118.9%24,113 21,142 14.1%
---
---
--------- --- ---
Small Commercial Vans ²
593
38155.6%6108 5695 7.3%
---
---
--------- --- ---
Total
2235
176226.8%30,221 26,837 12.6%
Source: Automakers 
² small commercial vans 
³ full-size commercial vans

RECOMMENDED READING
Commercial Van Sales In Canada - December 2014 & Year End
Commercial Van Sales In Canada - October 2014 YTD
Commercial Van Sales In Canada - November 2013 YTD
Canada Auto Sales Brand Rankings - November 2014 YTD
Top 13 Best-Selling Trucks In Canada - November 2014 YTD
Minivan Sales In Canada - November 2014 YTD

Midsize Car Sales In Canada November 2014 YTD

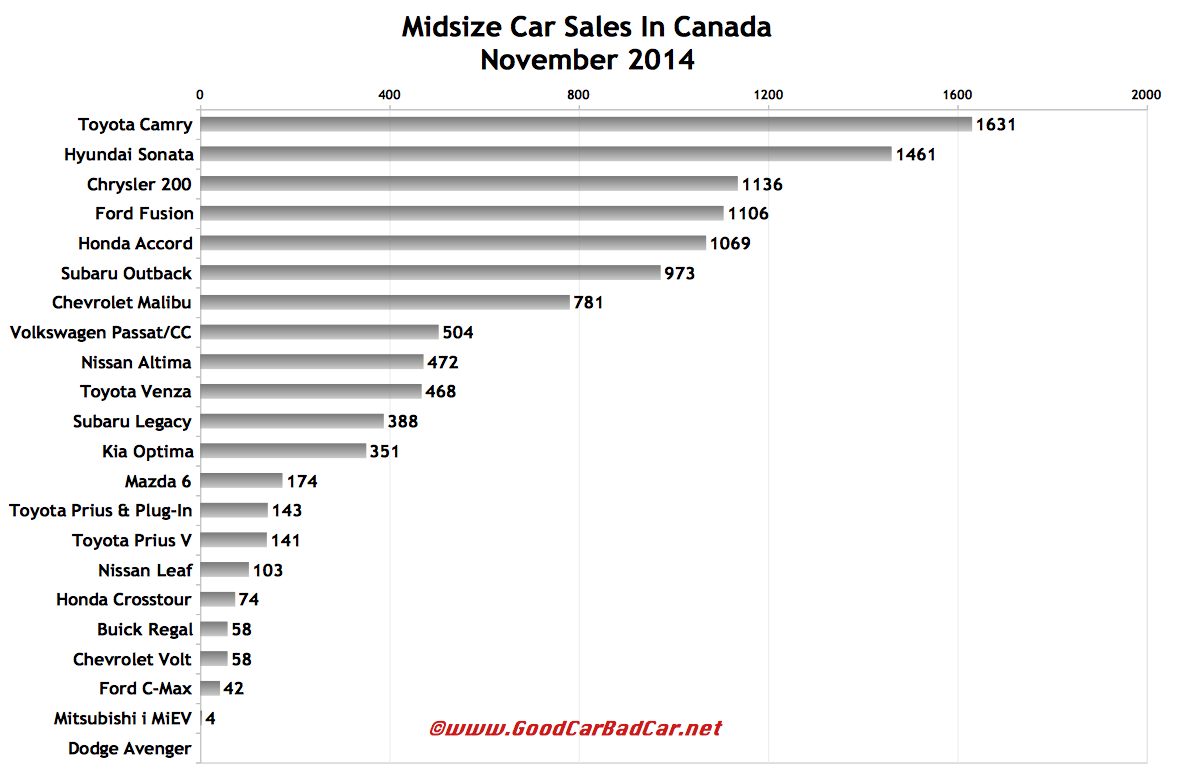
Heading into December 2014, no midsize car in Canada sold as often between January and November as the Ford Fusion. But the Fusion hasnt led on a monthly basis since June of this year. 


• Canada Vehicle Sales Rankings By Model - November 2014 YTD
• Canada Car Sales Rankings By Model - November 2014 YTD


Canada midsize car sales chart November 2014
Click Chart To Expand
Its lead over the second-ranked car at the halfway point, however, at 917 units, is mostly intact. The Fusion is 810 sales ahead of the Accord through eleven months, a lead the Accord is unlikely to surmount in December. 

Directly in keeping with the Fusions 12.6% loss through eleven months is the midsize categorys 12.6% decline, a loss of 15,677 sales for the core segment. 

Among volume players, only the Chevrolet Malibu and Subaru Legacy posted year-to-date increases through November. The Legacy is still a low-volume car, of course, but in comparison to the more premium-priced Buick Regal, its downright popular.

In November, it was the Toyota Camrys turn to take top honours. The Hyundai Sonata led through three months of summer. The Chrysler 200 was the top midsize dog in October. The Camry outsold the next-best-selling Sonata by 170 units in November.

You can click any model name in the tables below to find historical monthly and yearly Canadian auto sales data. You can also select a make and model at GCBCs Sales Stats page. These tables are now sortable, so you can rank midsize cars any which way you like. Suggestions on how GCBC should break down segments can be passed on through the Contact page.

Click Column Headers To Sort • December 2014 • October 2014 • November 2013
Midsize Car
November
2014
November
2013
%
Change
2014
YTD
2013
YTD
%
Change
Buick Regal
58
65-10.8%7476918.1%
Chevrolet Malibu
781
53546.0%7270624016.5%
Chrysler 200
1136
500127%10,800 11,334-4.7%
Dodge Avenger
---
279-100%4887548-93.5%
Ford Fusion
1106
1380-19.9%16,741 19,144-12.6%
Honda Accord
1069
1319-19.0%15,93116,289-2.2%
Hyundai Sonata
1461
13855.5%13,095 13,908-5.8%
Kia Optima
351
418-16.0%71759034-20.6%
Mazda 6
174
212-17.9%28774108-30.0%
Nissan Altima
472
611-22.7%8848 9774-9.5%
Subaru Legacy
388
170128%2648 185742.6%
Suzuki Kizashi
---
16-100%--- 269-100%
Toyota Camry
1631
14969.0%14,87016,871-11.9%
Volkswagen Passat & CC ^
504
716-29.6%70587158-1.4%
---
---
--------- --- ---
Total
9131
91020.3%108,548 124,225 -12.6%

Hybrids & Electrics
November
2014
November
2013
%
Change
2014
YTD
2013
YTD
%
Change
Chevrolet Volt
58
133-56.4%145985171.4%
Ford C-Max
42
90-53.3%12821312-2.3%
Honda Insight
---
--------- 65-100%
Mitsubishi i MiEV
4
11-63.6%102 166-38.6%
Nissan LEAF
103
30243%1021442131%
Toyota Prius
143
1420.7%1805 2265-20.3%
Toyota Prius Sedan ^
138
132
4.5%
1732
2058
-15.8%
Toyota Prius Plug-In ^
5
10
-50.0%
73
207-64.7%
Toyota Prius V
141
174-19.0%22132512-11.9%
---
---
--------- --- ---
Total
491
580-15.3%7882 7613 3.5%

Tall Wagons 
& Crossovers
November
2014
November
2013
%
Change
2014
YTD
2013
YTD
%
Change
Honda Crosstour *
74
82-9.8%8681054-17.6%
Subaru Outback *
973
50891.5%7834565038.7%
Toyota Venza *
468
815-42.6%72648451-14.0%
---
---
--------- --- ---
Total
1515
14057.8%15,966 15,155 5.3%
Source: Automakers & ANDC
* indicates a vehicle that is also shown in another GCBC segment breakdown
^ Prius breakdown by variant
^ Volkswagen Canada combines figures for the Passat and CC.
GCBC isnt here to break down segments, an impossible task for any group, but to display sales data for the sake of comparison. The more ways sales data can be displayed, the better. This explains why youll see the Outback and Venza listed with midsize SUVs, too... because readers have wanted it both ways. You can always find the sales results for EVERY vehicle and form your own competitive sets by using the All Vehicle Rankings posts.

RECOMMENDED READING
Midsize Car Sales In Canada - December & 2014 Year End
Midsize Car Sales In Canada - October 2014 YTD
Midsize Car Sales In Canada - November 2013 YTD
Top 20 Best-Selling Cars In Canada - November 2014
Canada Auto Sales Brand Rankings - November 2014 YTD
Small Car Sales In Canada - November 2014 YTD
Large Car Sales In Canada - November 2014 YTD